Data Viewing & Recording
The sendance-cloud: Client allows to visualize your smart devices' sensor data in real-time ("Live Data"), as well as recording it in various modes. To start off, we recommend reading the First Steps section and heading to the Live Data Workspace.
The below sections aim to introduce you to the concept of configurable data views, their types, what the differences between them in the Live Data Workspace and Recording workspaces are, and how to create a recording.
Data Views
Data Views describe data visualization elements of either the Live Data Workspace or the Recording > Create Recordings / Recording Details subworkspaces. The latter are equivalent to the Live Data Workspace with some adaptations specific to recordings. Two data view types (tabs) are available by default: (A): Graph View and Device View.
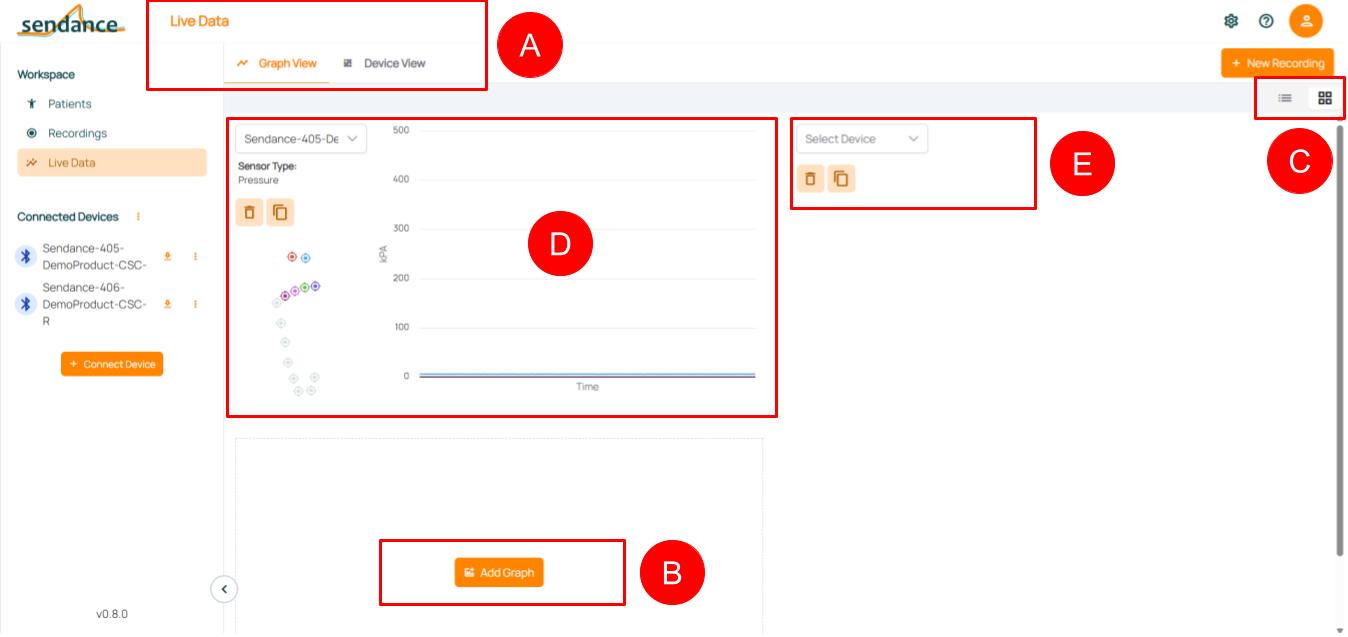
Data Views: Basic functionality -- Example: Live Data with Graph View
- (B) The "Add View" button in the bottom of the list lets you add multiple data views. Tip: Scroll down if you don't see this button on your screen!
- (C) Using and allows to switch between displaying data views in the current tab in a list arrangement (beneath each other; default) or in a grid-pattern (side-by-side), respectively.
- (D) A single data view always focuses on a single device, which you can select in the top left of the respective data view element. Additionally, with the buttons and you can delete or copy a data view. Other configuration options depend on the type of data view: these can range from selecting the sensor type, to adjusting graph axes or heatmap color schemes.
- (E) shows an added data view where the device (acting as the data source) still has to be selected. Available devices to select depend on the visualization type (e.g. Graph vs. Device View) and workspace (Live Data: only allows connected devices vs. New Recording: only allows devices involved in the recording).
We recommend limiting the amount of data views to about 4. If you experience performance issues (e.g. visualizations stuttering), reduce the number of data views being displayed -- the data recorded is not influenced by the data views being shown.
Configuration
Each data view can be configured separately, as well as their default values (i.e., settings chosen when adding a new data view). Their behavior may, however, also depend on the device acting as data source, e.g., how fast its sensor update period is.
Per- data view configuration: Each data view's default settings (e.g. y-Axis min/max values) depend on the User Preferences but changes specific to each view can be made directly in it. If a data view is configured in the Live Data Workspace, then it is associated with the device. I.e., everytime the device connects, the Live Data workspace will show the associated graphs in their custom configuration. If a data view is configured in the Recording Workspace, then it is associated to the recording. I.e., the data view's configuration will be restored when the recording is viewed at a later point. Specific configuration options in the respective data view types are detailed in the following.
Per-device configuration: E.g. To change the sensor update speed and with it the speed in which data views are updated in real-time, you can use:
- Quick Settings' Set Period for immediate changes in the update interval
- User Preferences' Bluetooth Device Settings for persistent changes in the update interval. Be aware, these are only updated when reconnecting the device.
Data View Types (Tabs)
The sendance-cloud: Client currently offers at least two types of device views by default. More may be visible depending on your license.
Graph View
In the tab Graph View, two-dimensional graphs can be added to the workspace.
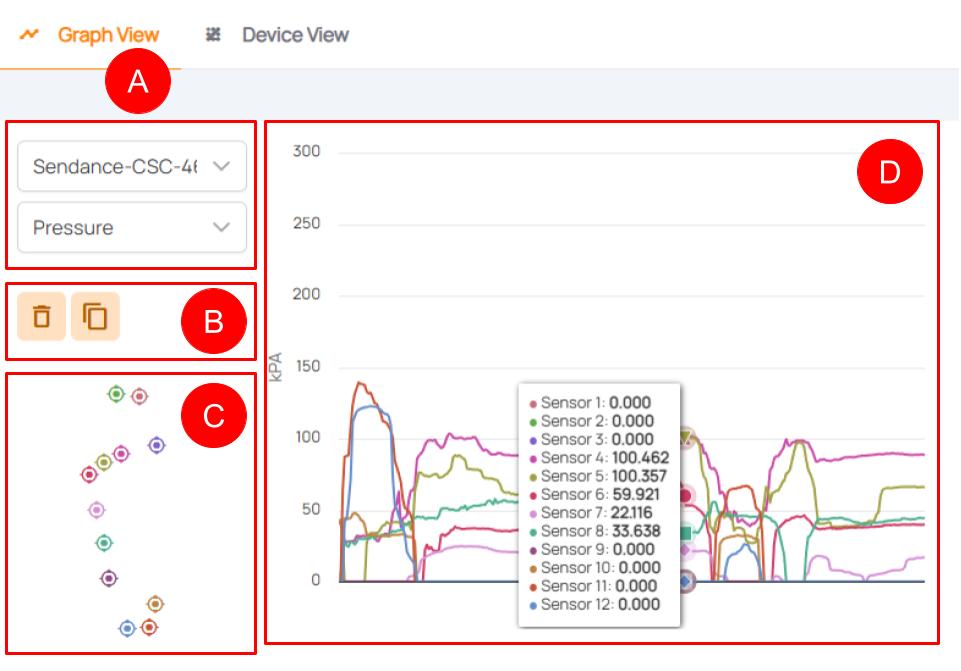
Graph View: Basic functionality -- Example: Pressure Data
- (A) The dropdowns in the top left allow to select the data source device as well as the sensor type.
- (B) These buttons allow to delete or copy the graph view.
- (C) This overview allows to quickly glance which sensors of the selected device are selected as data sources. To change this configuration (by default, only the first sensor is selected), click the preview. See the description below!
- (D) This graph shows all incoming or recorded data of chosen sensors and the axes and their unit. You can hover over the graph to view all sensor values at a certain point in time.
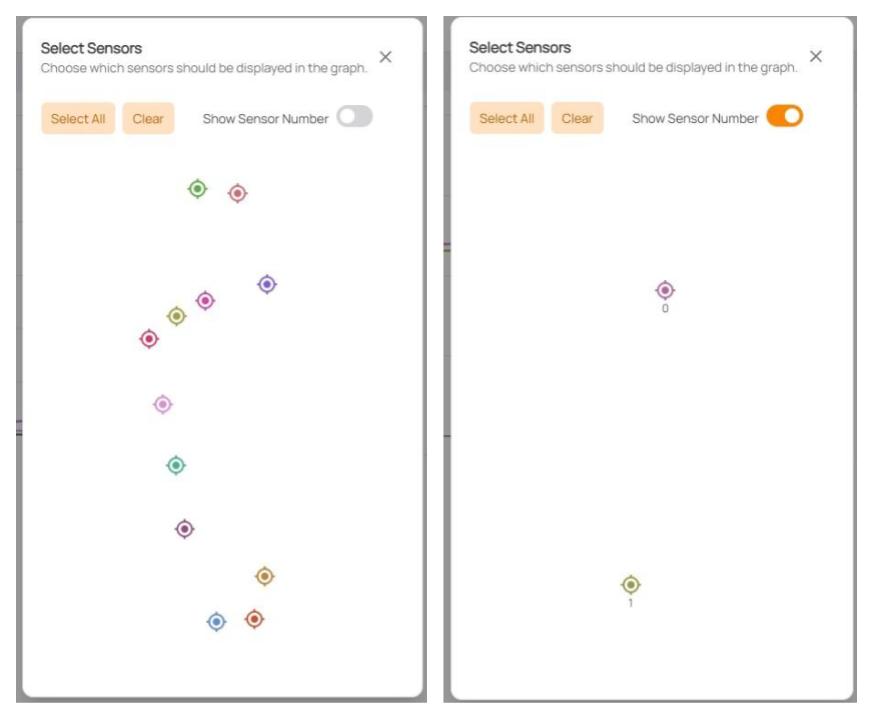
Select Sensors: When clicking the sensor overview (C), a window is shown that allows to select the sensors used as data sources. Use the "Select All" and "Clear" buttons or directly click on the "sensor dots" to (de)select the respective sensor. A grayed-out sensor indicates that it is not used as data source for the graph.
Device View
In the tab Device View device visualizations can be added. You can select a 3D model, depending on its availability for the selected device.
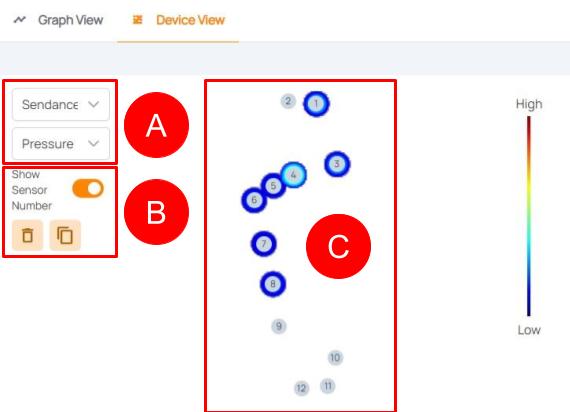
Device View: Basic functionality -- Example: Pressure Heatmap
- (A) The dropdowns in the top left allow to select the data source device as well as the sensor type.
- (B) The "Show sensor number" switch allows to show the sensor number on the heatmap. The buttons allow to delete or copy the device view.
- (C) The visualization shows a heatmap with the sensor arrangement. By default, transparent indicates no activation, blue indicates low activation and red high activation.
Features such as uploading your own 3D models, selecting multiple layers of data with various sources and many more are coming soon!
Workspaces and Data Views
Depending on the workspace, behavior and features of data views change. Their specialized characteristics, which go beyond the general description above, are described in this section.
Live Data
The Live Data workspace allows to view data from connected devices in real-time. While using it, data is only shown temporarily, i.e., nothing is recorded and saved. However, a recording can be launched using the "New Recording" button in the top right of the workspace.
Connecting a device for the first time: When connecting a device for the first time (as described in First Steps) or all previous data view configurations of a the selected type (tab) were deleted, a single data view in a default configuration is added automatically. This default data view has the first available sensor type (e.g. Pressure) with the first available sensor of this type (e.g. Sensor 1) selected.
Data view configuration persistence: While in the Live Data workspace, data views are associated with the selected devices. This means, the configuration is not lost when disconnecting the selected device. When the respective device is reconnected, the data view configuration(s) are restored. Data view configurations are only lost if they're explicitly deleted with the button.
Recordings > "Create Recordings" vs. "Recording Details"
Depending on whether a recording is started by clicking the "New Recording" button or an existing recording is viewed ( e.g. from the Recording workspace's recording list), either the "Create Recordings" or "Recording Details" subworkspaces are shown.
Their commonallities and differences are described in this section. Your current subworkspace is shown in the very top of each page, right next to the sendance logo.
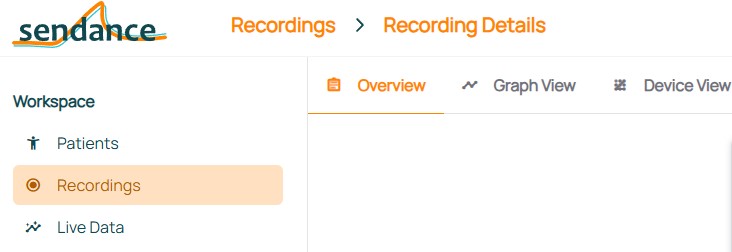
Recording workspace location in top bar -- example: Recording Details
Create Recordings
- Make sure all devices (and only devices) that should serve as data sources for the new recording, are connected ( see First Steps).
- Launch a new recording by using the "New Recording" button in the top right of the Recording and Live Data workspaces. The button is disabled if no devices are connected.

"New Recording" button in the top right corner of Live Data and Recordings workspaces. It is disabled if no devices are connected.
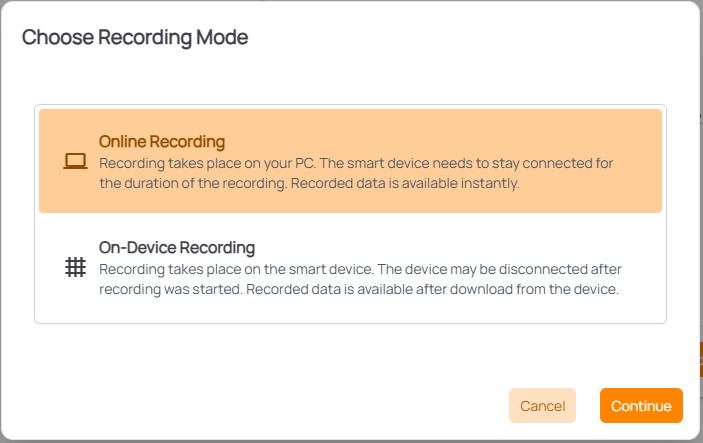
- Choose an appropriate recording mode:
-
Online Recording: Online recordings allow to view data recorded "live" in real time as is the case in the Live Data tab. However, the smart device(s) must stay connected via Bluetooth during the recording. In this mode, sensor data will be missing while the connection to a device is lost or interrupted -- the recording may continue though until it is explicitly stopped by the user. Data recording from the device will continue too, as soon as the device is reconnected.
-
On-Device Recording: On-device recordings allow to disconnect the device after starting a recording but not view data live. To stop the recording and retrieve its data, the smart device(s) must be reconnected and the data downloaded from it/them.
Make sure to carefully choose the correct mode, depending on your use case! It's recommended to do an on-device recording, if there is some probability of the Bluetooth connection being interrupted.
-
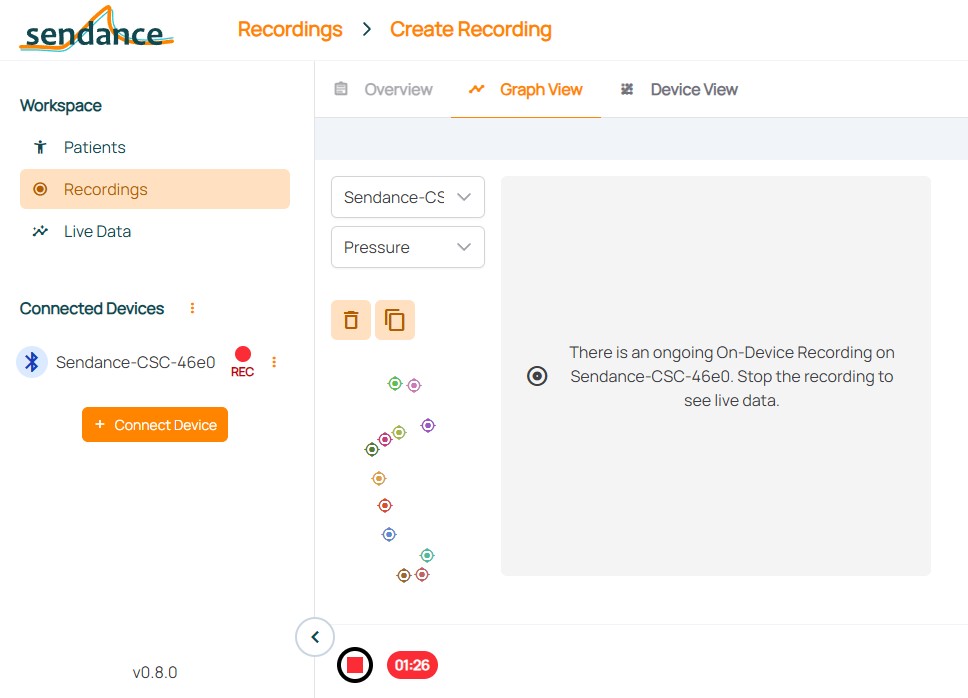
The Recordings > Create Recordings workspace will open up. Data is not being recorded yet. Especially for online recordings, make sure to add the data views you want to use for observing the recording in real-time (see the above instructions). Data views can also be manipulated during and after the recording. In an on-device recording, viewing data in real-time is paused until the recording ends.
-
To start the actual recording, press the red button in the bottom left of the screen.

- The button will change to and the timer next to it starts. In On-Device Recordings, data views are paused as shown below.
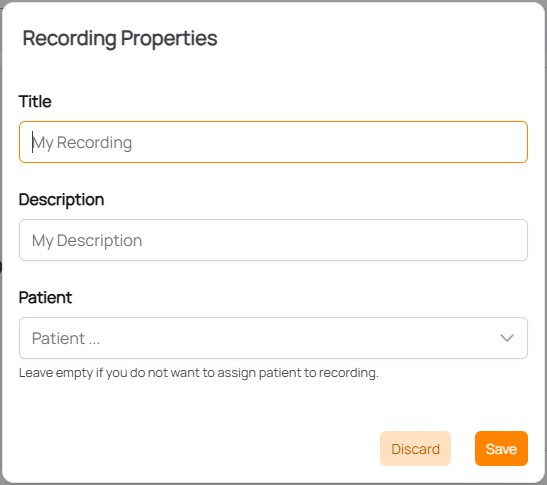
- To stop the recording, click the . You will then be asked to provide a name for the recording and further details like a related patient (optional). Pressing "Save" will then automatically upload the recording to the cloud. It can then be found in the Recordings workspace list.
- After saving the recording, you are automatically forwarded to the Recording Details view.
Recording Details
When selecting a recording from the Recordings list or after ending it in the Create Recording subworkspace, the Recording Details subworkspace is opened.
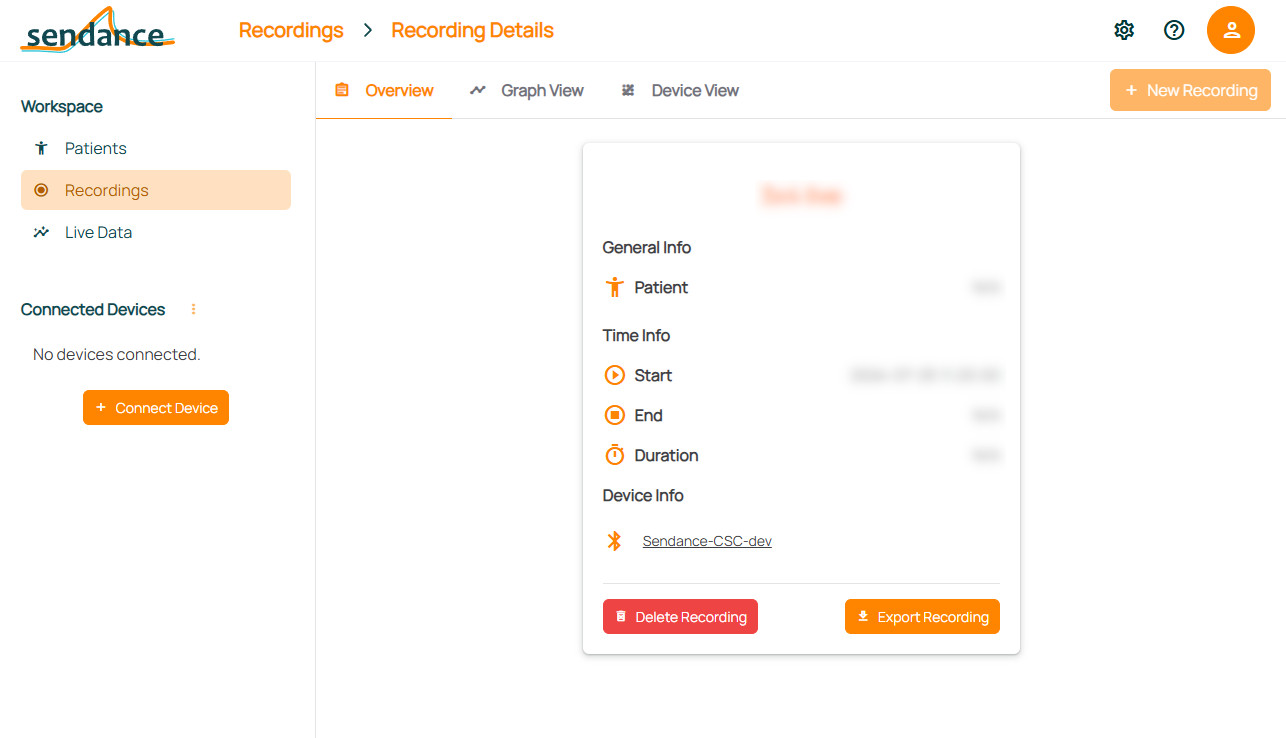
In comparison to the Create Recording subworkspace, it doesn't allow to start/stop a recording but works with existing, recorded, data.
The Overview tab provides properties of the recording, such as its title, assigned patient or involved devices. Here, you can further also delete the recording or export the recording. Clicking on a device's name listed in the Overview tab will display its properties (such as firmware version) at the time of recording.
Data View tabs, such as Graph View and Device View, provide the data views associated with the recording. In contrast to the Live Data workspace, they display the recorded data instead of continuously incoming new data. Other than that, data view tabs in Recording Details are just as modifiable as in the Live Data workspace. Their configurations are saved to the specific recording, instead of a selected device, though.
Upcoming Data View tabs include Gait Analysis, as well as the option to integrate your own custom analyses!
You can download the measurement data for your recording using the "Export Recording" button. The data will be downloaded as a CSV file. You can find instructions on how to import CSV files into Excel in this Microsoft article.